The 5 Most Reliable Chart Patterns for Forex Traders in 2025
1. Head and Shoulders Pattern: The Classic Reversal Signal
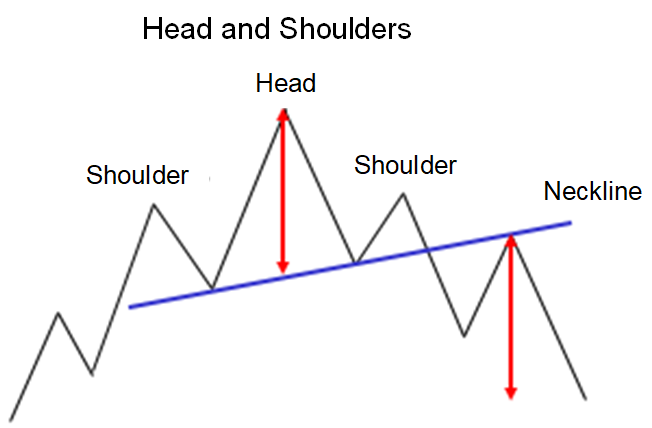
The head and shoulders pattern is a cornerstone in forex trading, known for its reliability as a reversal signal.
It emerges after a prolonged uptrend, signaling a shift in control from buyers to sellers.
The pattern’s structure includes three peaks. The left shoulder forms after a price peak followed by a pullback. The head peaks higher but fails to sustain. The right shoulder peaks lower than the head, marking the end.
Traders typically enter short positions after the neckline breaks.
The neckline, connecting the shoulders and head, acts as critical support. A close below this level confirms the pattern.
Conservative traders might wait for a retest of the broken neckline before entering. Aggressive traders, on the other hand, short immediately upon the break.
The target for the measured move is calculated by projecting the distance from the head’s peak to the neckline downward from the breakout point.
For instance, if the head peaks at 1.1000 and the neckline is at 1.0800 (200 pips apart), the target would be 200 pips below the breakout at 1.0800, reaching 1.0600.
Challenges with this pattern include:
- False breakouts where price dips below the neckline but quickly reverses
- The right shoulder failing to form symmetrically, making pattern recognition difficult
- Volatility increasing near the neckline break, requiring wider stops
Recent example: In Q2 2024, GBP/USD formed a textbook head and shoulders with the left shoulder at 1.2800, head at 1.2900, and right shoulder at 1.2750.
The neckline break at 1.2650 led to a 250 pip decline, hitting the measured move target perfectly.
2. Inverted Head and Shoulders: The Bullish Counterpart
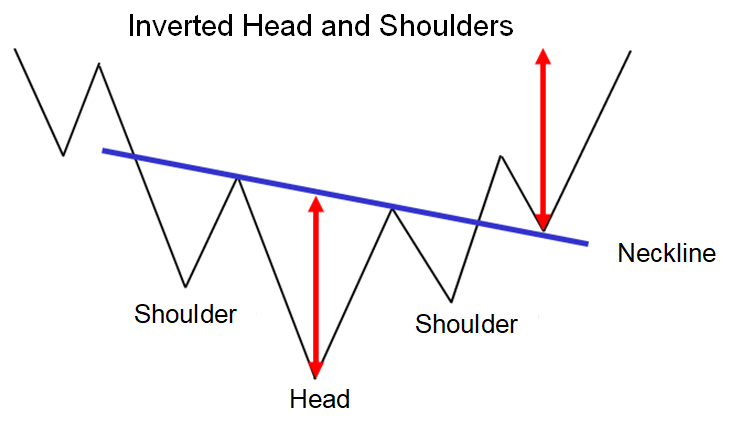
The inverted head and shoulders pattern is the mirror image of its bearish counterpart, forming at the end of downtrends.
This pattern signals that sellers are losing control and buyers are gaining ground.
The structure features three troughs. The left shoulder forms after a new low before bouncing. The head drops lower but fails to continue falling. The right shoulder forms a higher low.
Trading this pattern effectively requires patience.
Many traders enter too early, before the neckline break is confirmed.
The safest approach is to wait for:
- A clear close above the neckline
- Increased volume on the breakout
- The retest of the neckline as new support
The profit target is calculated by projecting the distance from the head’s low to the neckline upward from the breakout point.
Risk management is critical, with stops placed below the right shoulder’s low.
Common pitfalls include:
- Misidentifying the pattern during ranging markets
- Breakouts failing due to lack of follow-through buying
- Not accounting for major resistance levels above the pattern
USD/CAD presented a clear inverse head and shoulders in early 2024, with the head at 1.3200 and neckline at 1.3400.
The 200 pip breakout projection was achieved within three weeks after confirmation.
3. Symmetrical Triangle: The Consolidation Breakout Play
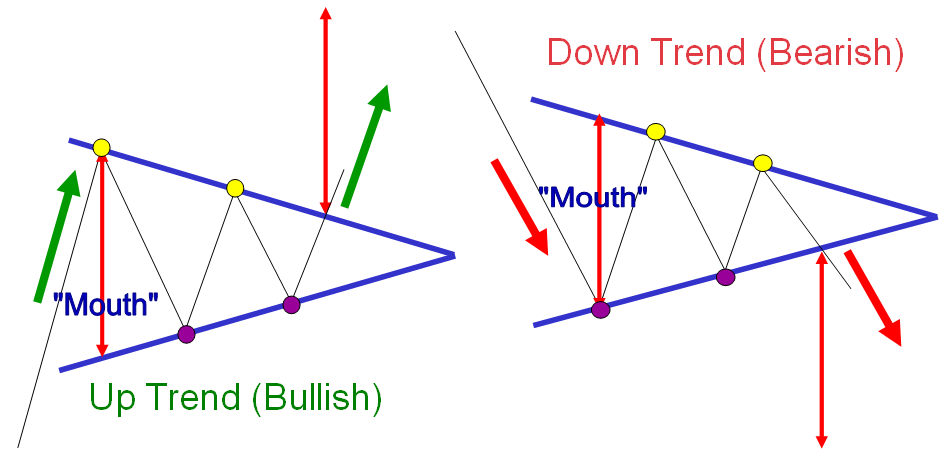
Symmetrical triangles mark periods of balance between buyers and sellers before a new direction emerges.
These patterns are identified by converging trendlines that link lower highs and higher lows, resembling a coil.
Unlike other triangles, symmetrical triangles lack a clear bias until the breakout.
Most traders follow these steps:
- Waiting for at least two touches on both trendlines
- Preparing for trades in both directions
- Assessing the breakout candle’s range for strength
The measured move target is found by projecting the triangle’s widest part’s height from the breakout point.
Day traders often find the cleanest moves in the first 30-60 minutes after a breakout.
Important considerations:
- False breakouts are common, affecting 40-50% of cases
- Volume confirmation boosts reliability
- The longer the consolidation, the stronger the breakout
EUR/USD showed a perfect symmetrical triangle in March 2024 after the ECB meeting. The 120 pip range broke upward, leading to a 180 pip follow-through.
4. Rising and Falling Wedges: The Sneaky Reversals
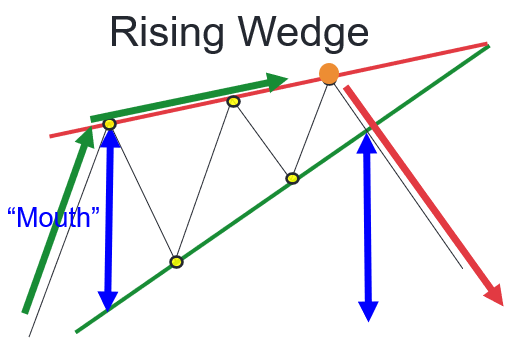
Rising Wedge (Bearish Reversal)
Despite its upward slope, the rising wedge often resolves downward.
The pattern is formed when price makes higher highs and lows, but rallies weaken.
The trendlines slope upward, but buying pressure wanes.
Trading strategies include:
- Looking for bearish divergence on oscillators
- Shorting on the breakdown with stops above recent highs
- Targeting the wedge’s origin point
Challenges:
- Distinguishing from genuine uptrends
- Premature entries before confirmation
- Sharp reversals trapping late shorts
Falling Wedge (Bullish Reversal)
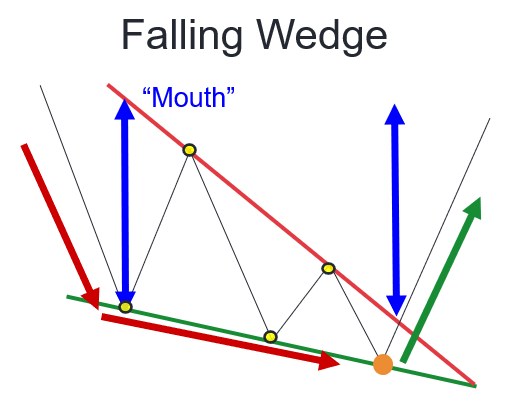
The falling wedge forms in downtrends with lower highs and lows, but selling pressure weakens.
The downward-sloping trendlines eventually give way to upside breaks.
Optimal trading approaches:
- Watching for bullish momentum shifts
- Buying the breakout with stops below the pattern
- Measuring the initial thrust for targets
Key risks:
- Misinterpreting as continuation patterns
- Low-volume breakouts failing
- Overhead supply capping rallies
AUD/JPY’s April 2024 rising wedge saw a 3.5% drop after breakdown, while USD/CHF’s May 2024 falling wedge yielded a 2.8% rally.
5. Double Tops and Bottoms: The Market Exhaustion Signals
Double Top (Bearish)
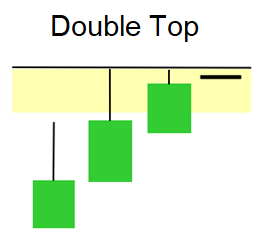
This pattern forms after uptrends when price tests a resistance level twice but fails to break through.
The “M” shape between two peaks signals buyer exhaustion.
Confirmation comes when price breaks below the intervening low (neckline).
Professional approaches:
- Shorting on neckline break with stops above right peak
- Using the height of the formation for targets
- Combining with overbought oscillators for confluence
Execution challenges:
- Distinguishing from temporary pullbacks
- Managing volatile false breakdowns
- Accounting for intervening news events
Double Bottom (Bullish)
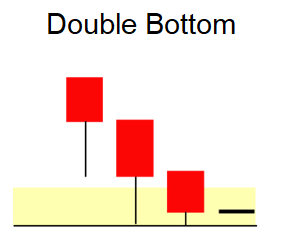
The bullish counterpart emerges after downtrends when price tests support twice without breaking lower.
The “W” formation confirms when price breaks above the intervening high.
Optimal strategies:
- Buying the neckline break with stops below right trough
- Measuring the formation height for targets
- Watching for volume spikes on breakout
Common mistakes:
- Entering before confirmation
- Ignoring overall market context
- Underestimating overhead resistance
GBP/JPY’s February 2024 double top led to a 400 pip decline, while EUR/GBP’s March 2024 double bottom produced a 180 pip rally.
Trading Major Currency Pairs with Chart Patterns
Major pairs like EUR/USD, USD/JPY, and GBP/USD exhibit these patterns most reliably due to their liquidity and participation. In 2025, traders should:
- Focus on patterns forming around key psychological levels (00 and 50 levels)
- Watch for patterns developing around major economic releases
- Combine pattern recognition with order flow analysis
- Adjust position sizing based on pattern size and timeframe
The USD/JPY has been responsive to head and shoulders patterns during BOJ intervention periods. EUR/USD frequently forms symmetrical triangles before ECB meetings. GBP pairs tend to respect wedge patterns during London sessions.
Advanced Pattern Trading Considerations for 2025
As algorithmic trading grows, traders must adapt to:
- Faster pattern formations on lower timeframes
- Increased false breakouts in major liquidity zones
- The importance of multi-timeframe confirmation
- Integrating machine learning tools for pattern detection
Successful traders in 2025 will combine these classic patterns with:
- Volume profile analysis
- Market depth readings
- News sentiment indicators
- Intermarket correlations (special focus on forex and oil)
Final Thoughts: Pattern Reliability in Modern Markets
While these five patterns remain highly effective, their application requires more nuance than ever. Traders must:
- Wait for clear confirmations before committing capital
- Understand the institutional context behind patterns
- Manage risk appropriately for each formation type
- Continuously backtest strategies against current market conditions
For the latest forex analysis on how these patterns are developing in live markets, visit ForexSmartStart.com for daily chart studies and trade breakdowns.
Remember – in forex trading, patterns provide the map, but discipline determines the destination.
Disclaimer
The information, strategies, techniques and approaches discussed in this article are for general information purposes only. Latest Forex Rates does not necessarily use, promote nor recommend any strategies discussed in this article. The information in this article may not be suitable for your personal financial circumstances and you should seek independent qualified financial advice before implementing any financial strategy.